Unified observability on one platform
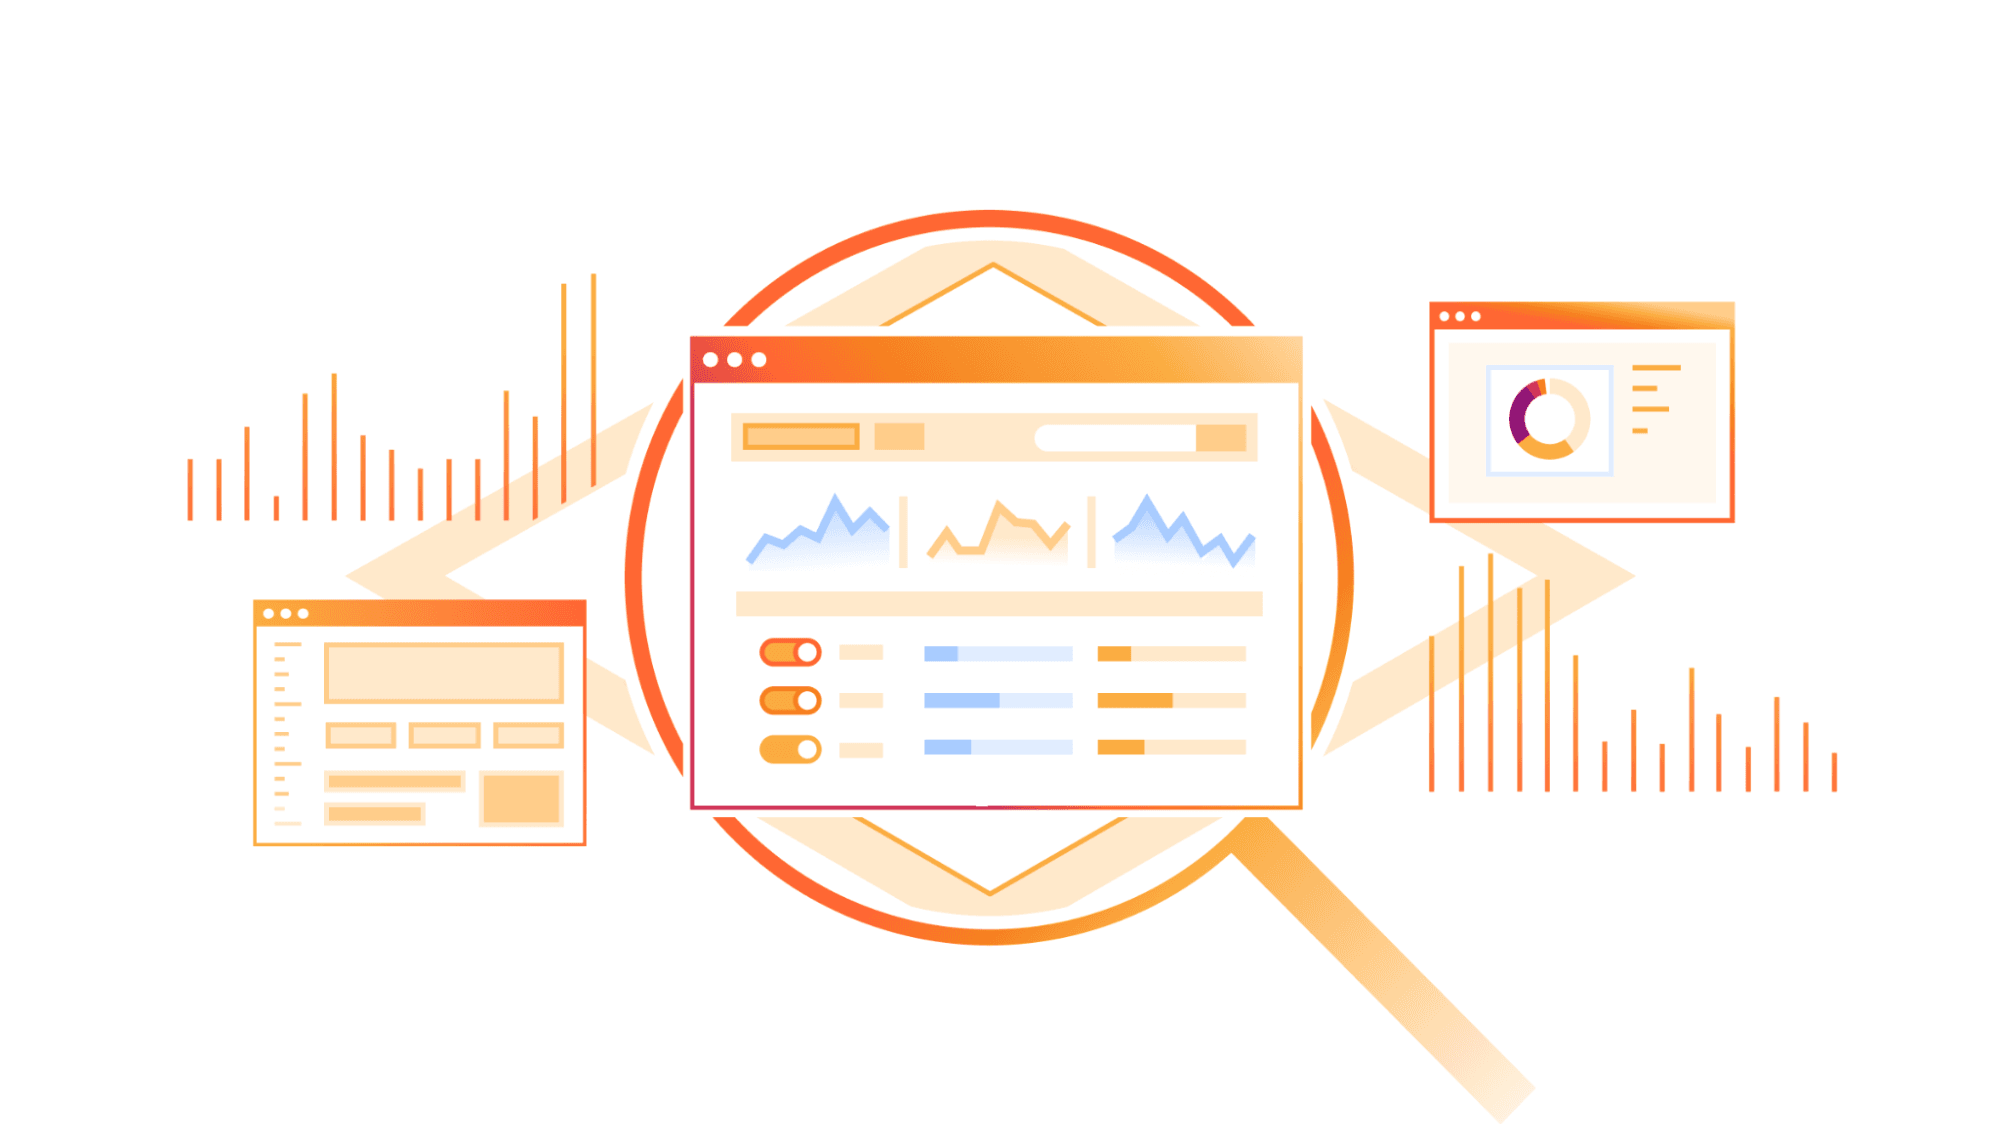
Cloudflare announced eight major updates that bring logs, traces, analytics, alerts, dashboards, and data export into a single observability platform. The goal is to eliminate the need to query data from different Cloudflare products separately when investigating an issue.
A new Logs home
The new Logs home combines Workers Observability with Log Explorer. Datasets such as HTTP events, firewall events, Workers, Containers, R2, and AI Gateway can be investigated with the same tools. Users can query with raw SQL or built-in filters, create visualizations with natural language, and inspect individual requests by Ray ID.
Cloudflare Traces in open beta
Cloudflare Traces is launching in open beta, offering a request-level view of supported security rules, transformations, cache decisions, routing, Workers, and origin handling. A baseline sampling rate can be set for continuous visibility, while Trace Rules capture specific traffic at a higher rate. Traces can be exported over OpenTelemetry.
Pricing and other updates
Cloudflare is introducing a single pricing model for observability data ingested and stored across the platform. All analytics for a domain are now gathered in one place with 30 days of data retention, custom dashboards can be built from observability data, and Logpush data export is now available on self-serve plans. The company says more products and datasets will join this shared platform in the coming months.